Do your own analysis
or visualize traffic safety at a glance
The traffic safety dashboard is a series of tools designed by UC Berkeley SafeTREC to allow users to visualize crash data and traffic safety activities in conjunction with demographics in California. If you experience any technical difficulties please contact the TIMS team at tims_info@berkeley.edu.
The Traffic Safety and Equity Overview Tool as well as the Safety Heat Map are available to use without a login. If you are an OTS official or an OTS grantee, please create an account to access Safety Program Activities in the Safety Heat Map and the OTS Grant Clearinghouse.
Identify at risk communities based on traffic safety and demographic data in California in 2021.
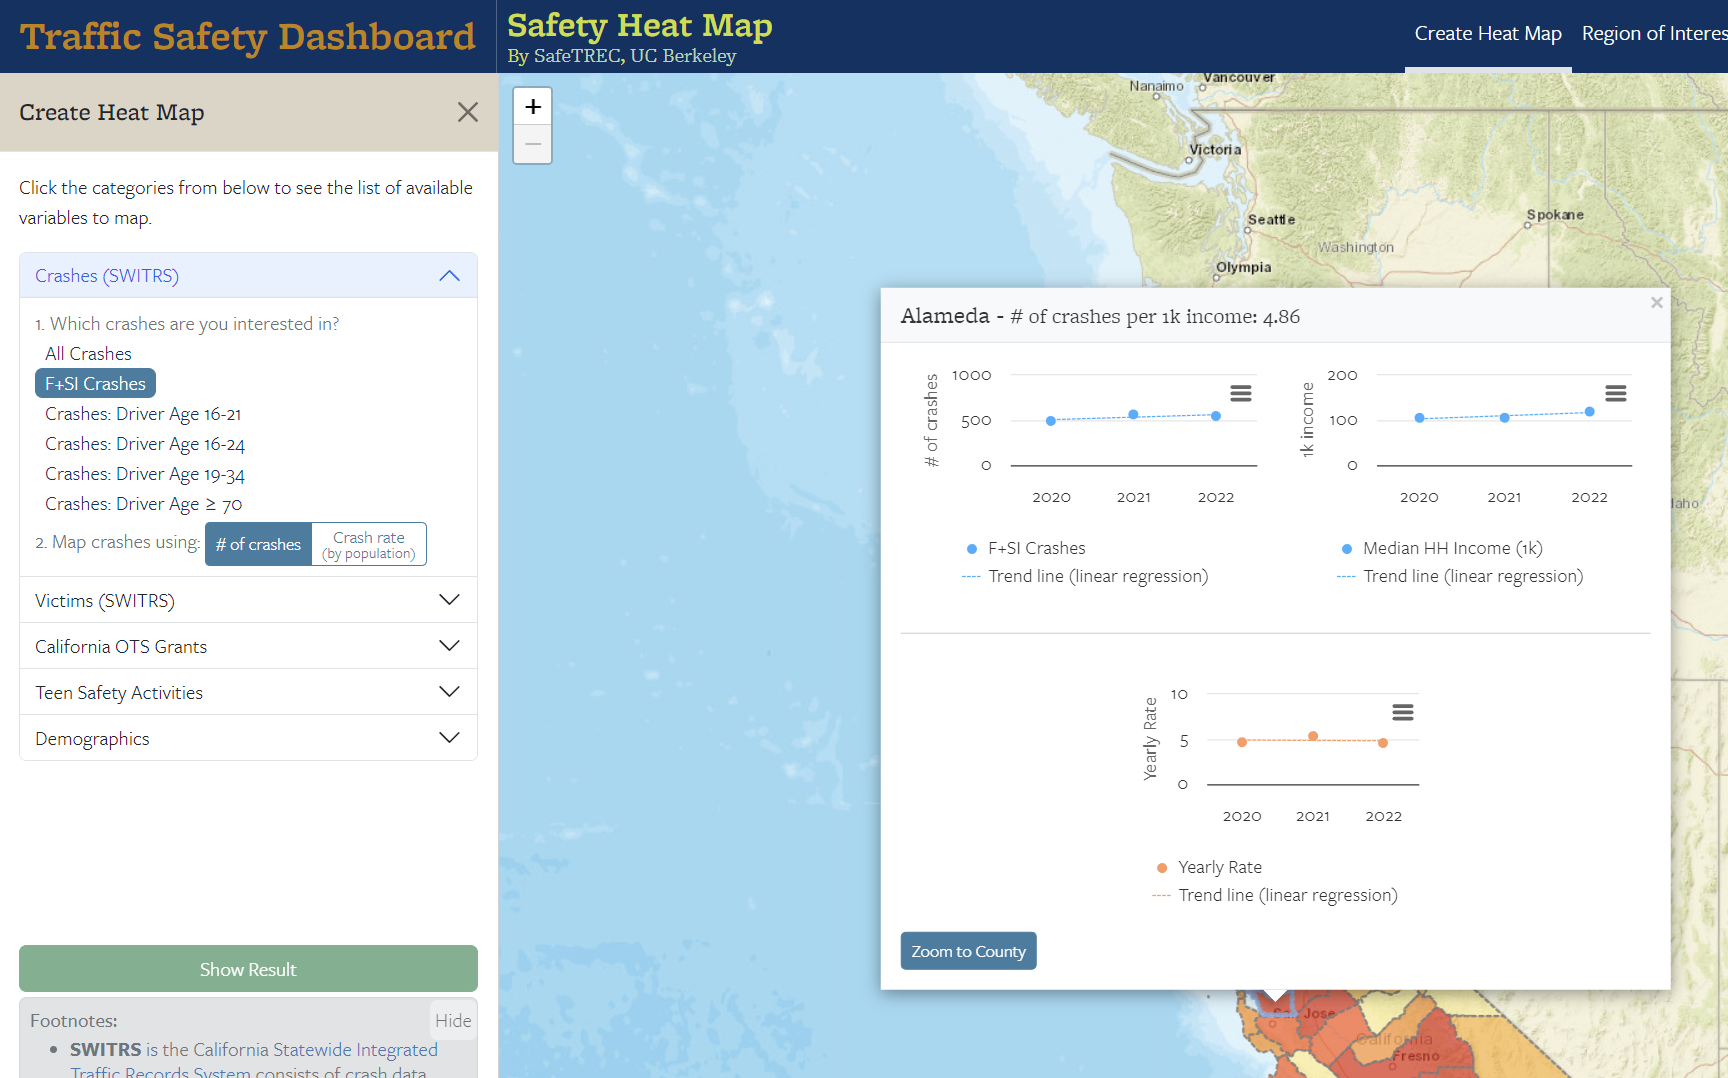
LaunchCreate interactive heat maps to visualize and analyze crash data and traffic safety improvement activities in California.
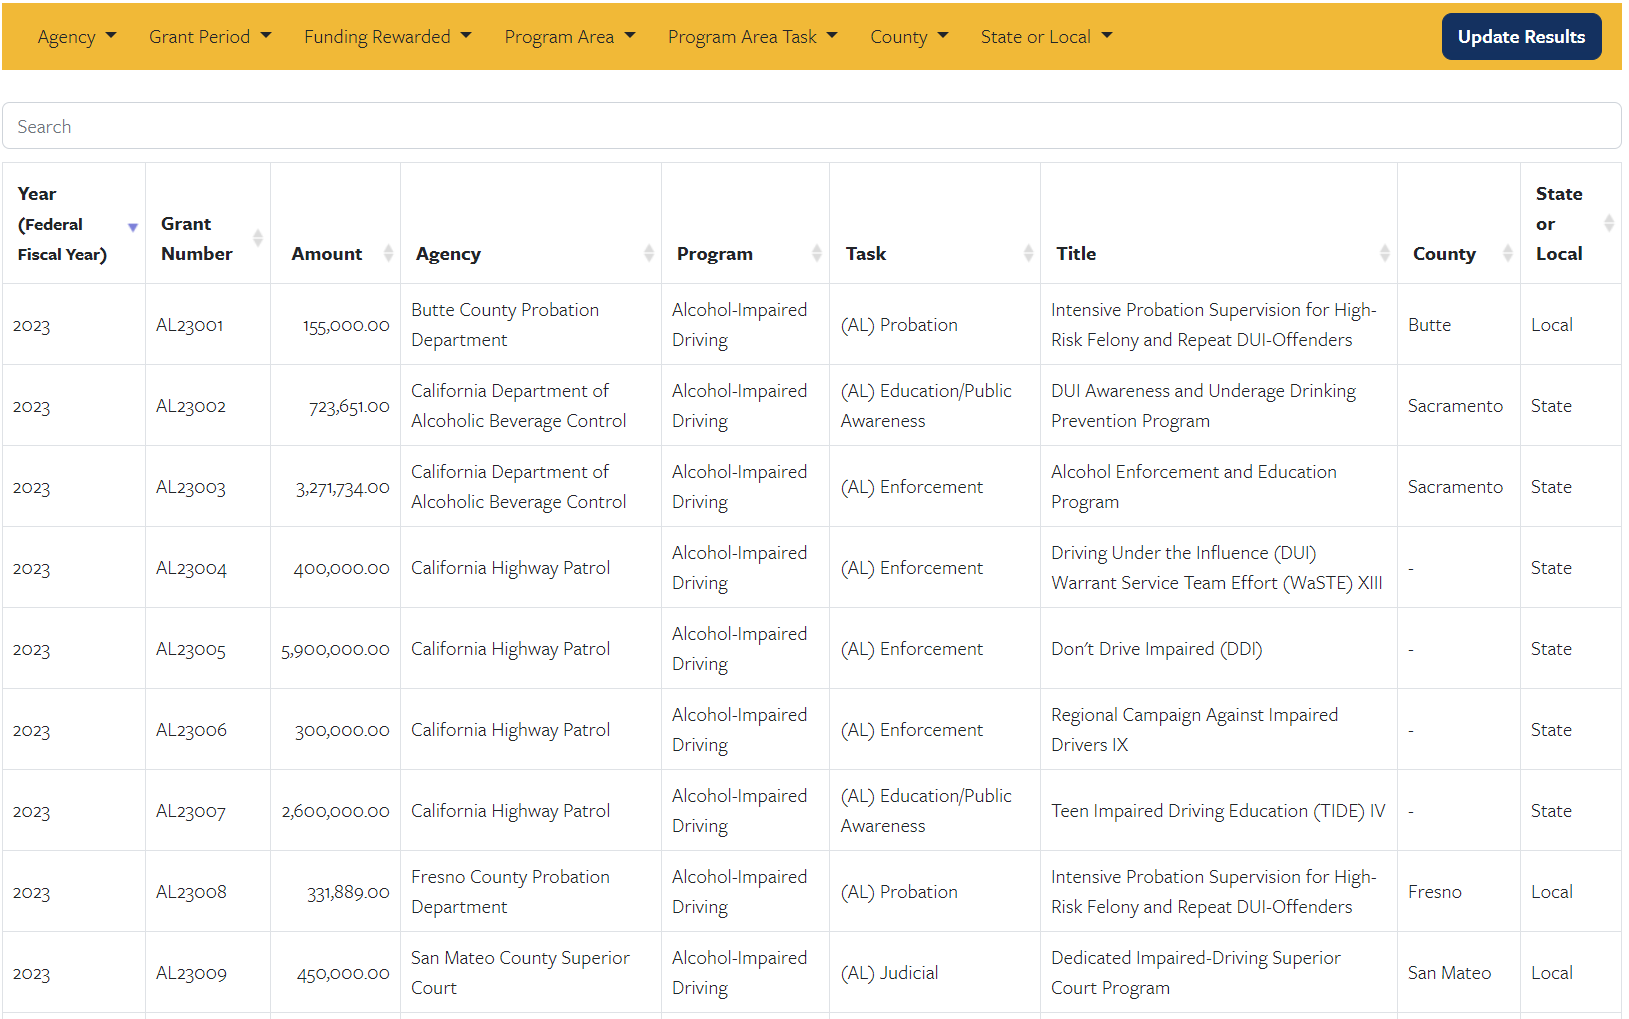
LaunchLook up the California Office of Traffic Safety (OTS)'s historical grants and find each grant's details.
Go